This is the time of year that we hear lots of parents stressing about math facts. In Long Beach, students in grades 2-5 are required to answer at least 65/70 facts correct in under 10 minutes (approximately 9 seconds per fact). In order for a student to receive a 4 on their report cards, they must be able to answer 68/70 facts correct in under 5 minutes (approximately 4 seconds per fact). This does not leave room for students to use aides, such as their fingers, a multiplication chart, or pictures. To help students pass these benchmarks, we use several different strategies.
First, we look at the four different ways that we can show multiplication using pictures. Here's an example:
 |
Source: Natalia Ginns
Then, we show students how they can use a multiplication chart to help them when they get stuck. This is a nice visual for three main reasons. 1) It's easy to find patterns in a multiplication chart that help you remember some of those tricky facts. 2) When students use it, we have them circle the product that they got stuck on so tha we can keep track of their "hard" facts. 3) We like to show students how the chart can be folded in half, demonstrating how there are only half as many facts to memorize.
|
Once we feel that students understand what multiplication is and how to represent it visually, we shift gears into multiplication memorization. We have all sorts of tricks for memorizing facts, and a variety of ways that students can practice them and drill themselves. One of our favorites are multiplication wheels.
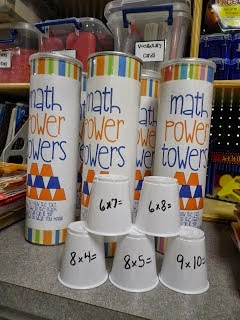
Another favorite is math towers.
If you missed our post abut our math facts Jenga, you can view that post
here.
We can't wait to help your students memorize those facts!


No comments:
Post a Comment